Measuring what a website brings in, from first visit to closed deal
How to measure what your website brings in: track enquiries, calls and bookings, carry each source into your CRM, and report won deals monthly.
- Nº
- 12
- Published
- Read
- 11 min
- Category
- Notes
- Written by
- Revylio
Measuring what a website brings in means following each enquiry to a closed deal
Measuring what a website brings in is counting the enquiries, calls and bookings your site produces. You then follow each one into your CRM until it becomes a won or lost deal. Traffic figures alone cannot tell you this. You need two systems joined up: analytics on the site and a sales record behind it.
Website analytics is the set of tools that records what visitors do on your site. As Strikingly's guide to website analytics puts it, its purpose is to show the site owner how effective their marketing efforts have been. A CRM (customer relationship management system) is the database where your team records each enquiry and what happened to it. Analytics sees the visit. The CRM sees the sale.
Neither one answers the money question alone. Analytics can tell you that a contact form was sent after a visitor clicked an advert. It cannot tell you whether that person signed a contract six weeks later. The CRM knows about the contract but not the advert, unless the website passes that detail along with the enquiry.
The rest of this guide covers four things in order. It shows which numbers prove a site works and how to set up conversion tracking. It then explains how to carry the source of each enquiry into the CRM, and what a simple monthly report should hold.
Visits by source show where people come from, not what they spend
Website traffic is the number of people visiting a site each month, as defined in Conroy Creative Counsel's list of website metrics. It is the first number most owners look at, and the least useful on its own. A busy site can produce no work, and a quiet one can fill your diary.
The traffic source metric in an analytics dashboard splits those visits by how people arrived. Visions Design describes the main types like this:
- Organic traffic: visitors from unpaid search engine results.
- Direct traffic: visitors who type your address into their browser, which often means they know the brand or have bookmarked the site.
- Referral traffic: visitors who click a link on another website, shaped by partnerships, backlinks and social sharing.
- Paid traffic: visitors from advertising such as pay-per-click (PPC) campaigns, display ads or sponsored content.
- Social traffic: visitors from channels such as Facebook, Instagram and LinkedIn.
Source data is worth having. Visions Design's guide to website traffic notes that analysing traffic sources lets a business refine its marketing and allocate resources more efficiently. But a source report still ends at the visit. To judge where to spend, you need to know which source produced enquiries, and then which source produced paying customers.
Enquiries, calls and bookings are the numbers that show a site works
The numbers that show a business website works are the actions that start a sale: a sent contact form, a phone call, a booking or a downloaded guide. Analytics calls each of these a conversion. A conversion is a visit that ends in an action you have chosen to count.
Conroy Creative Counsel describes goal tracking, usually set up through Google Analytics, as the way to monitor how often visitors complete key actions. Its examples are concrete:
- filling out a contact form;
- downloading a resource or guide;
- calling the office from a mobile device.
A booking made through an online calendar belongs on the same list, because it is the clearest sign of intent a site can produce. The conversion rate is the share of visits that end in one of these actions. Visions Design lists conversion rate first among the key performance indicators to watch, ahead of page views, bounce rate and average session duration.
When the conversion rate is low, the cause is usually on the page. Conroy Creative Counsel names unclear calls to action, contact details that are hard to find, and content that does not match what the visitor needs. Each of these is a design problem you can fix, which is why tracking conversions comes before any argument about traffic.
Setting up conversion tracking in Google Analytics, step by step
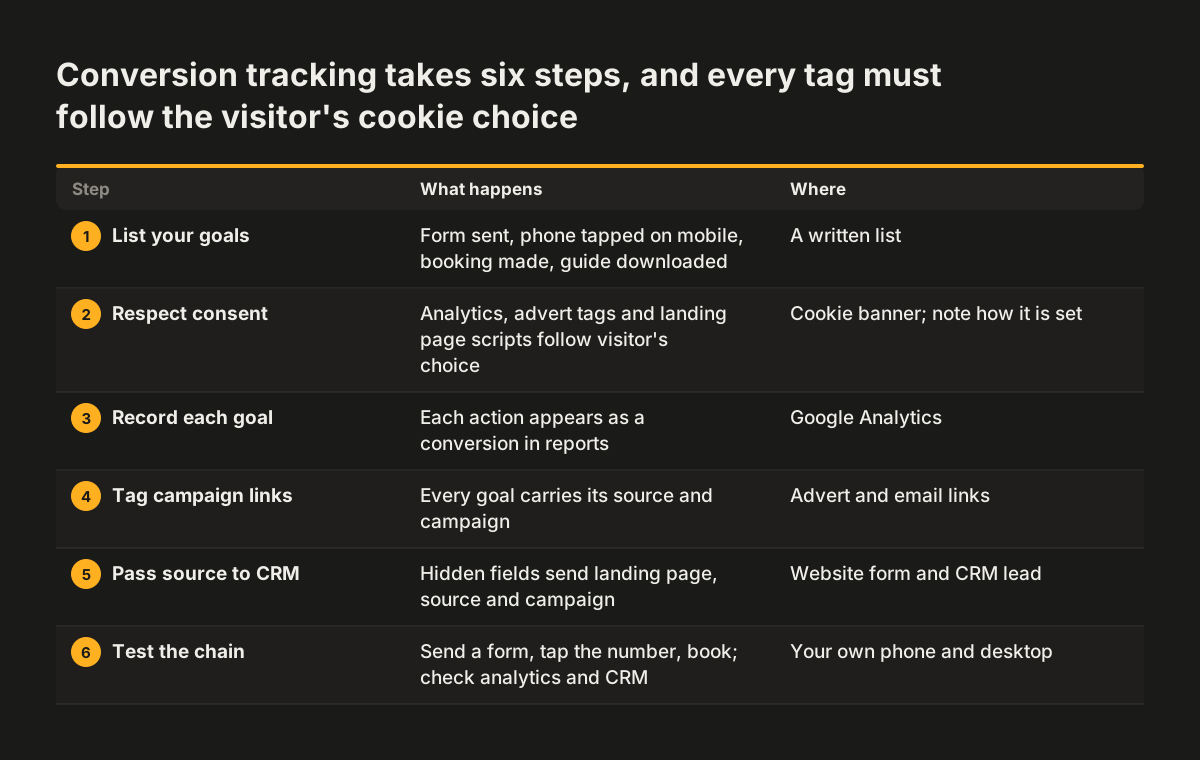
Conversion tracking is set up by naming each action you care about, recording it as a goal in your analytics tool, and tagging your campaign links so every goal carries its source. Google Analytics is the usual tool. Strikingly notes that its standard version is enough for newcomers who need the basic tools. Adobe Analytics is an alternative, generally used by people with more advanced technical skills.
Work through the setup in this order:
- List your goals. Write down every action that can start a sale: form sent, phone number tapped on mobile, booking made, guide downloaded.
- Record each one as a goal. Set up goal tracking for each action so it appears as a conversion in your reports, not just as a page view.
- Tag your campaign links. Strikingly explains that inserting specific links lets analytics tools track visitor activity for each campaign. Use a tagged link in every advert, email and social post.
- Respect the visitor's consent choice. Configure analytics to follow the choice the visitor makes in your cookie banner, and keep a note of how it is set.
- Test every goal. Send a form, tap the phone number and make a booking yourself, then confirm each one shows up against the right source.
Consent has a practical side for measurement. Visitors who decline analytics will not appear in your conversion counts. Their enquiries still reach you, which is one more reason the CRM, not the dashboard, is your final count of enquiries.
Carrying each enquiry's source into the CRM
An enquiry's source reaches the CRM only if the website form sends it there. A form that ends in an email inbox loses the trail: someone reads the message, replies, and the link back to the advert or search that produced it is gone. On a redesigned Revylio site, enquiries from site forms arrive in the CRM as leads rather than in an inbox.
A lead record is useful for measurement when it holds three details beyond the visitor's message:
- the page the visitor first landed on;
- the traffic source, such as organic, paid or referral;
- the campaign tag from the link they clicked.
At Svennis we pass these details into each lead through hidden form fields, and the failure we see most often is a redesign that keeps the form working but quietly drops those fields. Nobody notices for months, because enquiries keep arriving. Only the report goes blank.
Once the lead is in the CRM, your sales team does the rest. They move it through your stages and mark it won or lost, with a value when it is won. That last step closes the loop between the visit and the money. Our post on connecting website forms to a CRM covers the form side in more detail.
Worked example: one paid click followed to a closed deal
A single paid click shows how analytics and the CRM work together. In this example, a prospect finds you through a Google Ads advert. Visions Design explains that with pay-per-click you bid on keywords and pay your bid each time someone clicks. Keyword prices in its guide range from as little as 10p up to £5 per click.
- The click. The prospect searches, clicks your advert and you pay for the click. The advert's link carries a campaign tag.
- The visit. Google Analytics records the session as paid traffic from that campaign.
- The conversion. The prospect reads your service page and sends the contact form. Goal tracking counts a form conversion against the paid campaign.
- The lead. The form creates a lead in the CRM, with the landing page, source and campaign filled in from hidden fields.
- The deal. Your salesperson qualifies the lead, sends a quote and marks the deal won, with its value.
- The report. At month end you group won deals by source and set them against what each source cost.
Here is why step six matters. At the top of that price range, 100 clicks cost £500. Analytics can tell you how many of those clicks sent a form. Only the CRM can tell you how many became customers and what they paid. Divide the spend by the number of won deals and you have the cost of one customer from that campaign.
Checklist: what to track, where it is recorded, and what it answers
A complete measurement setup records six things in two places, and each one answers a different question. Use this table as a checklist when you review your own site, or when you brief whoever builds it.
| What to track | Where it is recorded | Question it answers |
|---|---|---|
| Visits by source | Analytics | Where do visitors come from? |
| Form enquiries | Analytics goal and CRM lead | Which pages and sources produce enquiries? |
| Calls from mobile | Analytics goal | How many visitors pick up the phone instead? |
| Bookings and downloads | Analytics goal and CRM lead | Who shows clear intent before speaking to you? |
| Source on each lead | CRM lead record | Which channel did this enquiry come from? |
| Won deals and value | CRM deal record | Which channel produces paying customers? |
The first four rows tell you the site works. The last two tell you what it earns. If your setup stops at row four, you can prove activity but not income.
A simple monthly website report on one page
A useful monthly website report fits on one page and ends with money, not visits. Pull the first half from analytics and the second half from the CRM, for the same calendar month.
The report needs these lines:
- visits by source;
- conversions by type: forms, calls, bookings, downloads;
- conversion rate for the whole site and for your main service pages;
- new leads in the CRM by source;
- deals won by source, with their total value;
- spend on each paid channel;
- one line on what changed on the site that month.
Compare two numbers every month: form conversions in analytics and form leads in the CRM. They will rarely match exactly, because some visitors decline analytics. A sudden gap is different. It usually means a form, a goal or a hidden field has broken, and you want to catch that in the same month.
Keep the report the same from month to month. Trends matter more than any single figure, and a fixed layout makes a change easy to spot.
Bounce rate and funnel drop-off show where enquiries leak
Bounce rate shows where visitors leave before they could enquire. A bounce is a visitor who lands on a site and leaves after viewing one page, and bounce rate is how often that happens. Conroy Creative Counsel reports a median bounce rate of 44.82% across all industries in 2023, though rates vary by industry.
A high bounce rate on a page that should produce enquiries deserves attention. Conroy Creative Counsel lists the common causes:
- slow-loading pages;
- a poor mobile experience;
- a confusing layout or navigation;
- irrelevant or unhelpful content.
Strikingly adds that website analytics can show exactly where prospects drop out of a sales funnel. On a service site the funnel is short: landing page, service page, contact page, form sent. Find the step where most people stop and fix that step first.
Speed is often the cause. Our guides on what a slow website costs in enquiries and what to fix first on a slow website walk through how to find and close that leak.
What measuring website income means for a UK business
For a UK business, measuring what a website brings in turns marketing spend in pounds into a cost per customer you can defend. Pay-per-click prices of 10p to £5 per keyword, as quoted by Visions Design, add up quickly. Without the CRM side, you can see the spend but not the return.
Timing matters when you compare channels. Visions Design notes that PPC can start to drive traffic within days if done correctly. SEO, by contrast, is not an overnight fix but can pay off over time. A month of data will flatter paid adverts and undersell search, so judge organic traffic over several months of won deals.
Tracked income also shapes what your site is worth if you sell the business. Moaflip's website valuation guide gives a typical rule of 24 to 36 times monthly revenue. Its example: a site earning 1,000 euros a month would sell for around 24,000 to 36,000 euros. Moaflip adds that sites with strong organic traffic usually command more than those relying heavily on advertising. A buyer looks at net profits, long-term gains and revenue streams, and a CRM record of won deals by source is evidence of all three.
Next steps: check your tracking this month
The quickest way to start measuring what your website brings in is to test the chain you already have. Most sites have some of it in place, and the gaps are easy to find in an afternoon.
- Send your own contact form, tap your phone number on a mobile and make a test booking. Check each one appears as a conversion in analytics.
- Find your test enquiry in the CRM. Check it holds the landing page, source and campaign, not just your name and message.
- Look at last month's won deals. Count how many have a known source. That share is how much of your website income you can currently prove.
- Draft the one-page report above, even if half the lines are empty. The empty lines are your list of fixes.
If the chain is broken in several places, a rebuild may be cheaper than patching. Revylio's website redesign service starts with a Discover stage covering traffic, enquiries and what search actually sees, and includes a Connect stage that sends form enquiries into the CRM as leads. Every changed address gets a 301 redirect at launch, so old links and search results lead to the new pages. To weigh that choice first, read when a website redesign pays off.